


DATA DOWNPOUR
IMPROVED INFORMATION GATHERING HELPS FARMERS COPE WITH WILD WEATHER
BY ALLISON FINNAMORE
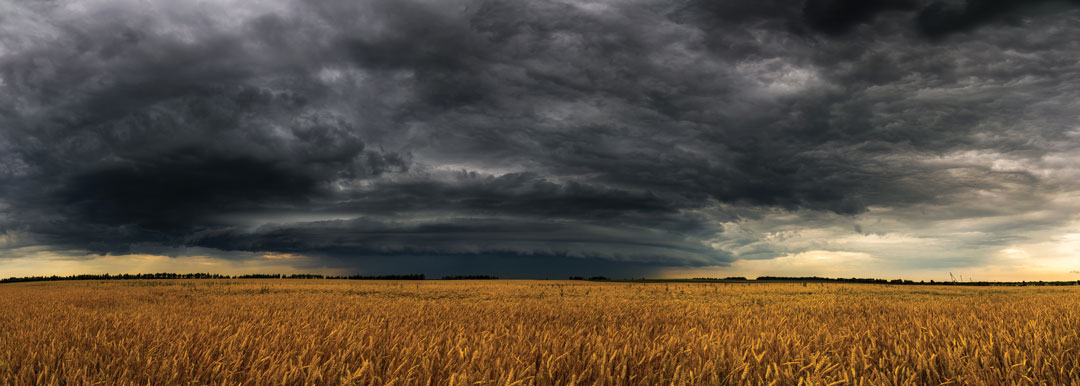
The fortunes of Alberta farmers are perennially subject to the wild whims of the weather. The province’s uniquely variable meteorological movements have forced climate scientists to continually beef up their data-gathering, information-interpretation and prediction powers. While actively changing the weather is possible in localized measure, experts focus their energy on upgrading forecasting technologies and updating weather models that will give farmers the best information with which to make agronomic decisions.
Dan Kulak, an Edmonton-based meteorologist with Environment Canada, said the Rocky Mountains are largely to blame for the unpredictability of Alberta’s weather. “The mountains rip those weather systems apart and they re-form near Red Deer in a long north-south corridor.”
As winter turns to spring, the re-forming of these weather systems, combined with still-cool air temperatures, can often result in springtime rain turning to snowfall. “You want to have April showers bring May flowers, but often in Alberta it’s May snow,” Kulak added.
The accumulation of snow combined with subsequent rainfall can create flood conditions, Kulak said. He also noted the foothills receive high precipitation levels and, depending on which river the rain and snowmelt flows into, flooding can occur.
Terry Young grows wheat, barley, faba beans and canola near Penhold. “Variableness is the key to weather in Alberta,” he said. Young pointed to Environment Canada’s weather updates. Delivered throughout the day, he noted each can be completely different. “Every forecast is changed from the last. You get up in the morning and you think you’re going to go cut some hay, and then the next forecast, it’s completely changed,” Young said.
For Ralph Wright, manager of Alberta Agriculture and Forestry’s Alberta Climate Information Service (ACIS), an online interactive weather tool that features historical and real-time meteorological data, looking at historical weather data is just as important as the current weather forecast, if not more so. Wright also said real-time weather can be critically important in aiding decisionmaking in the field.
“I imagine that every day every farmer wakes up and wonders, ‘What’s the weather going to be like?’ What they are missing is what was the weather like? Did it rain last night? How long has it been since it rained on my corn field that’s down the road that I haven’t visited for a week?”
Knowing such weather information for a specific field can help guide decisions depending on the time of year, helping farmers choose whether to spray or wait, irrigate or not, harvest or hold off, Wright said.
ACIS information can also be used in concert with analytics on yields, he noted. At the end of the growing season, farmers can use collected data to determine the effects of weather on individual fields. Combined with management records, the historical weather data can be a powerful farm management tool.
The collection of meteorological information at ACIS generates a long-term view of weather trends in specific areas, Wright said. With 12,000 maps of Alberta weather and climate-related information as part of the ACIS information trove, he said his job is to continue collecting data over the “long, long, long term” in order to develop quality historical weather data.
“Do not take the last months of weather to try to predict the next month of weather, because it just doesn’t happen that way anymore,” Wright said. Weather data extending back to the early 1960s can now be used to track trends and improve the accuracy of predictions.
Wright said ACIS emerged in 2002, the same year the Prairies experienced one of the biggest droughts in years. Albertans were left without detailed historical weather data or current information on weather conditions in specific areas around the province, so the drought—while devastating for crops—helped solidify the need for ACIS, he said.
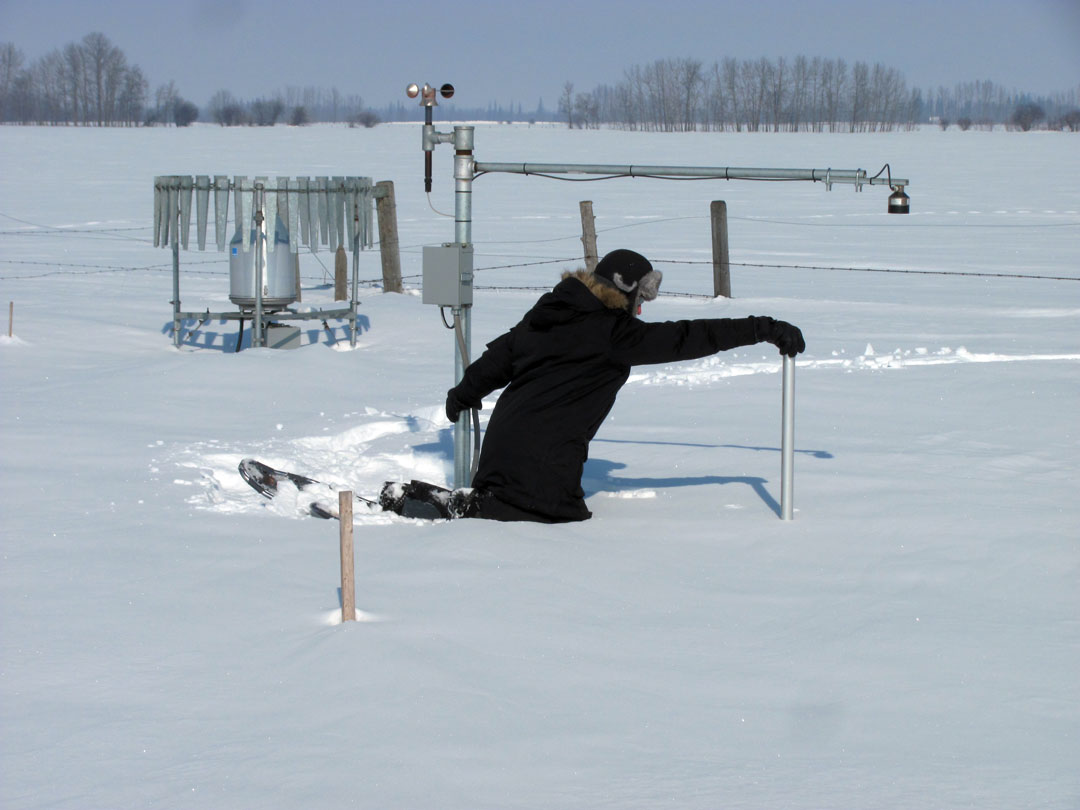
Since then, ACIS has strengthened its network of weather stations to 400-plus, all measuring air temperature, wind speed and precipitation levels. Around 40 of the stations also record soil moisture and soil temperature data, and approximately 80 measure solar radiation. All capture radar imagery, taking an atmospheric picture every 10 minutes. These images are then used to create animated weather maps.
ACIS has come a long way since its inception. Wright noted that in years past, volunteer weather monitors would take their own measurements and send the information to Environment Canada. The recording of this information would take several weeks, making any immediate use of the information impossible. “Hourly data with agriculture is very important,” said Wright. “ACIS brought the hourly weather observations of more than 400 weather stations province-wide, together.”
As ACIS has grown and evolved, so have the needs of the agricultural users of the weather data it produces. As weather patterns change, the level and spread of disease and insect pressures likewise evolve.
The weather has a definite impact on Fusarium head blight (FHB) treatment and
spread, Wright said. Infectious FHB spores are spread by wind, blowing from one cereal field to another, potentially resulting in significant loss in yield and quality. The effectiveness of fungicide is also impacted by wind speed and humidity levels.
Last year, in collaboration with ACIS, the Alberta Wheat Commission launched the Fusarium Head Blight Risk Tool, a mobile-friendly website available at weatherdata.ca. By tracking disease risk, the tool puts data in farmers’ hands that can help in making informed management decisions. This includes FHB severity values, precipitation levels, air temperature and humidity levels. By accessing ACIS FHB data, farmers are able to examine precipitation levels on their farms from as recently as 10 minutes prior. Radar information provides views of approaching storm clouds and rainfall paths. Further development will see the inclusion of other ag-pertinent data. Information on swede midge and alfalfa weevil will be added this year.
Wright suggested farmers visiting the ACIS website (agriculture.alberta.ca/acis) for the first time begin by finding the closest weather station to their farm. Look at weather data from the last hour and check conditions from the previous day. He said farmers may also want to look at growing conditions from last season and further back. Search features include wind speeds, soil moisture depth, growing degree days and almanac details.
“You can zoom right to your area and see precipitation from the last 10 minutes and do radar forecasts,” Wright said. “Farmers can look at storm clouds and wonder, ‘Should I spray or plant? Where are those clouds going?’ The information on the website tells them the answer to those questions.”
ACIS logs as many as 10,000 users a month from May to September. Usage spikes at planting, growing and harvest phases of the season, as well as whenever major weather events occur, Wright explained.
He pointed out that everyone from greenhouse operators to crop producers can find value in this real-time weather information. While greenhouse operators can use the data to determine cloud cover and track potentially damaging windstorms, crop producers can check wind speeds to decide whether or not to spray, and those with irrigation operations can use the data to guide water usage. Naturally, every farmer is interested in the occurrence of possibly damaging hailstorms.
Such hail information is important to farmers like Young, whose land is located in Alberta’s Hailstorm Alley, which takes in the area around Calgary in a strip that runs north of Red Deer. Young suggested he’s likely in one of the worst hail areas of the province.
At over 1,000 metres above sea level, the region’s high elevation sees air from the upper atmosphere remain closer to the ground than in lower-lying areas. Hailstorms form when moisture-laden air from the Pacific Ocean travels east over the Rocky Mountains. This cool, dense and wet air drops to ground level, displacing warm summer air and creating a weather spin cycle that pushes water droplets to higher altitudes where they freeze. They fall and are again pushed higher by updrafts, forming into hail pellets.
“The worst time for hail is mid-July to late August, when the weather is really hot. It’s devastating when it happens,” Young said, recalling one storm during the 1970s that took out his entire crop.
Such devastation prompted the Alberta Severe Weather Management Society to launch its Alberta Hail Suppression Project in 1996. Program director Terry Krauss explained that the society is mostly focused on urban areas, dissipating an average of 31 storms per year. As part of this process, billions of microscopic silver iodide particles are released from airplanes into threatening storm clouds. The particles act as artificial ice that freezes the already cooled water drops within the storm’s updraft. As a result, billions of additional ice crystals form, competing for excess cloud moisture. The result is the production of ice particles that either melt completely or fall as diminished hailstones. “Instead of large, damaging hailstones, multiple small stones creating less damage are formed,” explained meteorologist Kulak.
Looking ahead to the 2018 growing season, Prairie farmers will certainly be monitoring moisture levels. In a January edition of The Western Producer, agricultural meteorologist Drew Lerner of World Weather Inc. in Kansas City predicted the Canadian Prairies could see more early moisture this spring due to an anticipated weakening of La Niña weather phenomena that could also result in dry conditions in late spring and early summer.
The U.S. National Weather Service Climate Prediction Center also issued a statement saying La Niña crested in mid-January and is expected to weaken going into spring. “Forecasters believe this weak-to-moderate La Niña is currently peaking and will eventually weaken into the spring,” the agency stated in a January press release. It added that La Niña will create below-average temperatures and above-median precipitation across the centre of the continent.
La Niña is characterized by unusually cold water temperatures in the Pacific Ocean near the equator. The opposite of La Niña is El Niño, when ocean temperatures in the same area are unusually warm. The two weather systems tend to impact North American weather, including Alberta’s, by either creating cooler winters with more snow (in the case of La Niña) or warmer winters with less snow (when El Niño is present).
The variability of Alberta weather keeps farmers and meteorological experts striving to find the best way to work with this unpredictability. In addition to the province’s innovative weather monitoring and compilation of historical data, Young said he and his farming colleagues bring their own unique element to weather prediction—their sixth sense. “We move when the time is right. It’s like intuition. There’s a certain point in time when you have to get it done.”
As far as facts go, weather-modelling and data-collection technology is changing quickly, which means an increasing number of resources are available to help farmers make agronomic decisions. While these may not completely eliminate uncertainty, they do strengthen the decision-making process.


Comments