


 43 / 52

BY SARAH HOFFMANN
more electricity, but so do soils with high
salt content that tend to be in saline areas.
To effectively manage areas with varied
EC ratings, Willness ground-truths his
data by soil testing, talking to the farmer
to understand the way the land has per-
formed historically and getting a visual
understanding of the depressions, mid-
slopes and knolls of the field. He combines
this data to create a prescription map,
noting areas of the field that will be more
or less responsive to nutrient inputs.
“Let’s say you test a field and the tops of
hills are low in phosphorus and sulphur
and the depressions are the opposite,” said
Willness. “The fact that it’s a wet, average
or dry year does not change the fact the
depressions are not the most responsive to
phosphorus and sulphur, so you could just
put a maintenance rate on there.”
DATA DECISIONS
Marrying soil and vegetation data is a
challenge for farmers and agronomists
alike. The sheer quantity of data that can
be collected is daunting, not to mention
the various ways it can be interpreted,
quantified and layered. Working in the
Edmonton and Peace regions, Nuffield
scholar and agronomist Kristina Polziehn
uses aerial mapping combined with her
on-the-ground experience. Her company,
Axiom Agronomy, provides standard
services such as soil sampling and crop
scouting as well as aerial imagery from
drones and manned aircraft.
She cited a lack of reliable data as the
main challenge to the utilization of map-
ping by farmers. Ideally, this data should
be gathered over a long time frame and
include properly assigned causes for the
variations in the images and information.
“People say you need 10 years of good
data,” said Polziehn. But while there are
decades of satellite imagery available, she
noted that for most of that time, there’s
been no one in the fields determining
why variations exist. “Were those a result
of disease? Surface disturbance? Bush
removal?
“If you’re using data in order to build a
layer into a yield map and it is bad data,
you might not be ahead in putting that in,”
said Polziehn. “Doing a little bit of histor-
ical ground-truthing and utilizing quality
data is important.”
Polziehn said that widespread on-farm
adoption of remote sensing and the maps
it produces is fairly low, and for good
reasons. For example, creating prescrip-
tion fertilizer maps and uploading them
to seeding equipment can be time con-
suming and the process varies from one
brand of equipment to another. On large
farms with multiple operators, it can
be difficult to train everyone and make
sure variable-rate application is always
engaged. As well, analyzing data is time
consuming.
“Even myself, I have access to so much
data, but even if I had a satellite image
come in every second day, would I be
looking at that email? Probably not.”
While she continues her research into
the world of remote sensing and farmers
continue to work toward applying the data
effectively on their farms, it’s important
to remember that no map is a silver bullet.
“Remote sensing is not a stand-alone
technology,” said Polziehn. “It’s to be com-
bined with other pieces of information.
It’s maybe going to take time to figure out
where it layers in.”
Kristina Polziehn’s Nuffield Scholarship is
supported by the Alberta Wheat Commission.
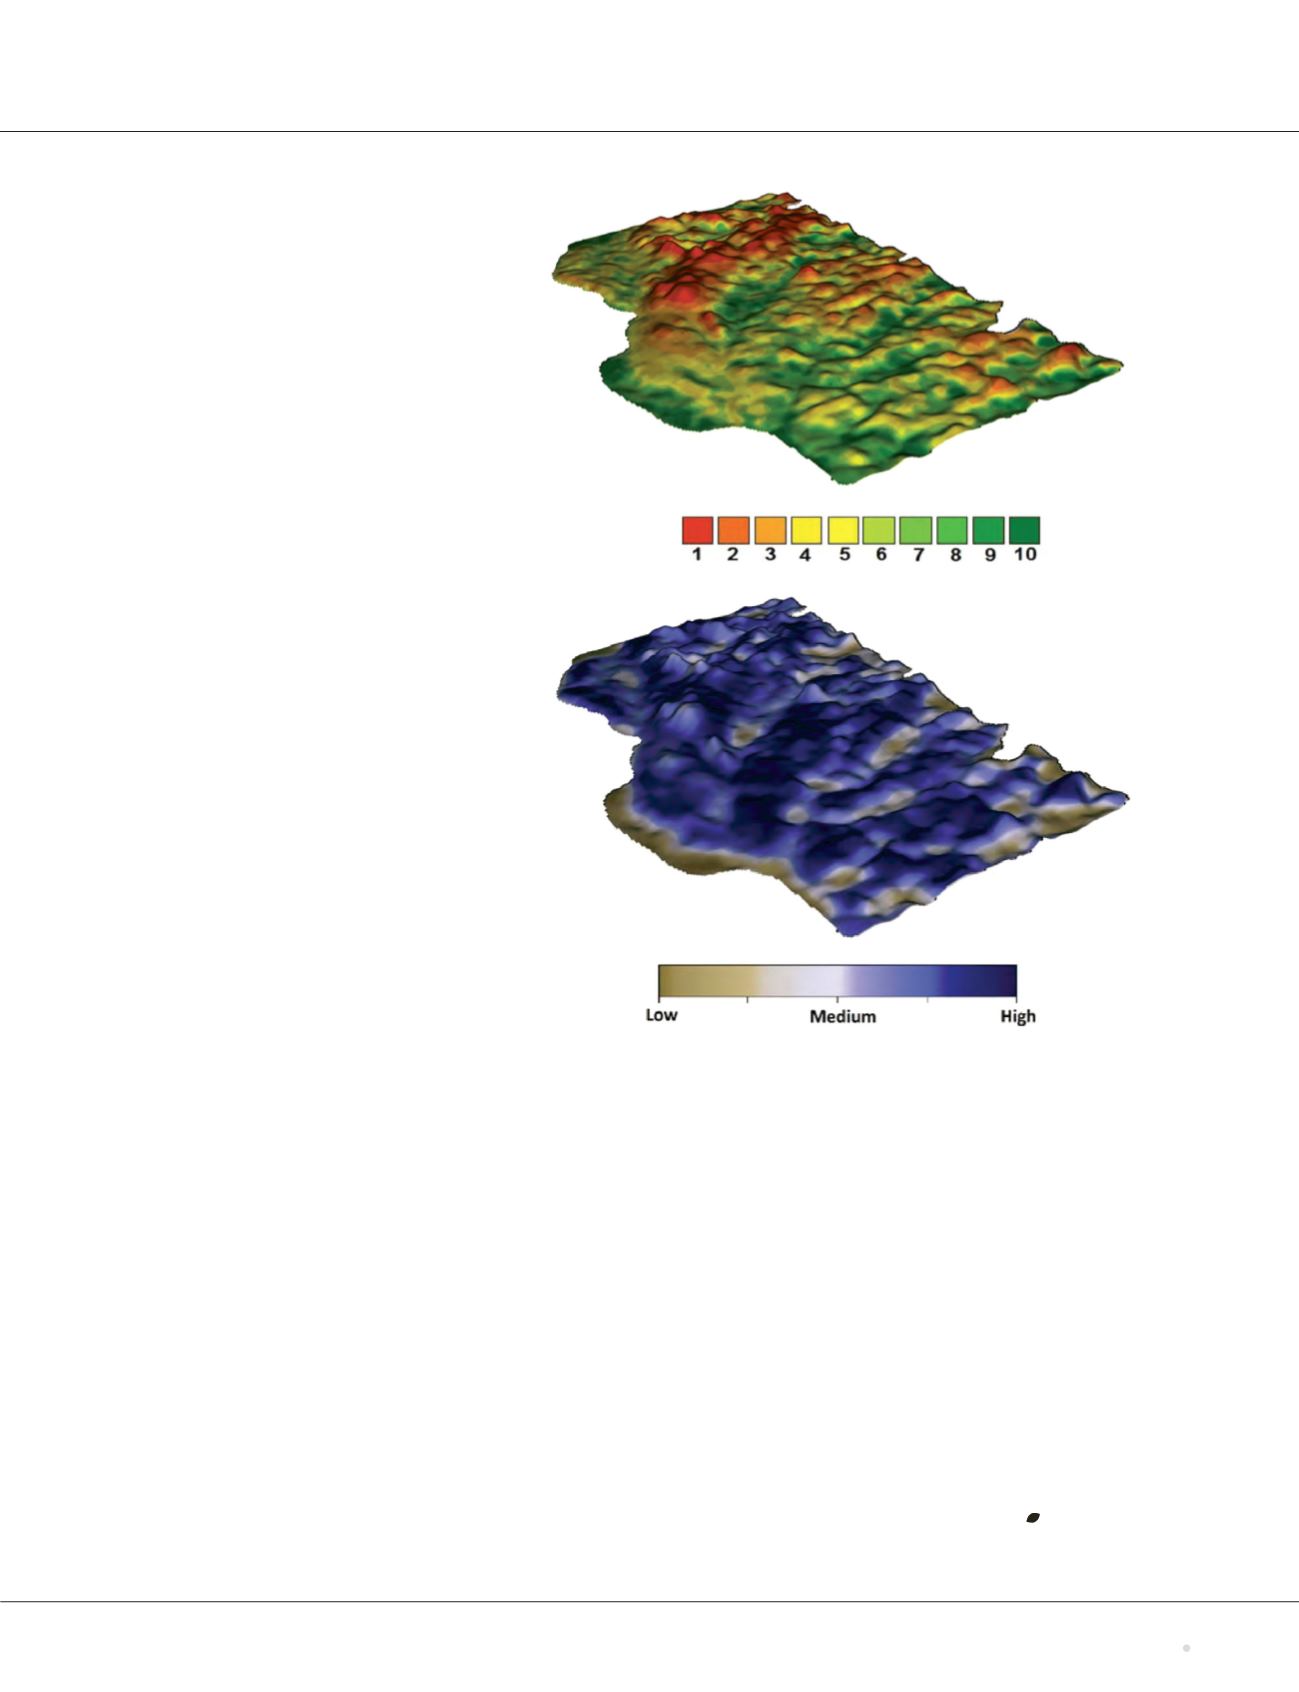
As high electrical conductivity ratings don’t necessarily correspond with high soil potential, CropPro’s
CoryWillness ground-truths mapping data with soil tests and farmer input.
Winter
2018
grainswest.com43