


 42 / 52

TECH
@WORK
Dataharvesting
THE USEOFMULTIPLE, COMBINEDMAPPING TECHNOLOGIES IS ACOMPLEX FIELD
FARMERS KNOW THAT SOILS AND
crops exhibit variability. From Alberta’s
first soil surveys in the 1920s to today’s
vegetation and soil electrical conductivity
maps, the mapping of these variations has
influenced how farmers manage the mul-
titudinous factors that affect crop yield.
Remote sensing technology as a means
to collect data not visible to the human
eye is on the rise in agriculture. Satellites
began mapping vegetation in the 1970s
using near-infrared wavelengths. Advanc-
es in technology propelled agricultural
mapping from yield potential to actual
yield through on-combine yield monitors
in the 1990s. Farmers and agronomists are
increasingly turning to manned aircraft
equipped with various sensors as well as
fixed-wing and rotor drones to assist them
with crop scouting and the creation of
prescription maps.
Infrared plus thermal mapping can
determine when it’s time to move cattle
from one pasture to the next, while
vegetation maps can reduce chemical
bills by informing in-season application
decisions. Mapping can also determine
variances in weed pressure, allowing
farmers to spray in accordance with prev-
alence, and it can locate inefficiencies in
irrigation systems by detecting increases
in plant temperature.
Farmers and their consultants now
combine these and other mapping tech-
nologies to create layers of data, with the
goal of maximizing return on investment.
GROUNDED ADVICE
While vegetation, thermal and yield maps
display information about above-ground
plant life, soil scientists and imaging ser-
vice providers focus on mapping what is at
or beneath ground level.
Cory Willness of CropPro Consulting in
Naicam, SK, uses soil electrical conductiv-
ity, topography, water flow maps, organic
matter and old-fashioned soil sampling
to create prescription fertilizer and seed
maps for his farm clients. While many
companies build input recommendation
prescriptions based on yield monitor data
and vegetation maps, Willness believes
soil, water and topography maps are
the most reliable tools for guiding input
decisions.
Willness noted yield maps generally
prescribe the same fertilizer treatment
to all areas with similar yield but do not
take into account the reasons for yield
variations. “You can have low-yielding
areas because of flooding, and in another
area it might be because it’s sandy or it has
bugs or disease. So you run a real risk of
making assumptions that all low-yielding
areas shouldn’t be fertilized.”
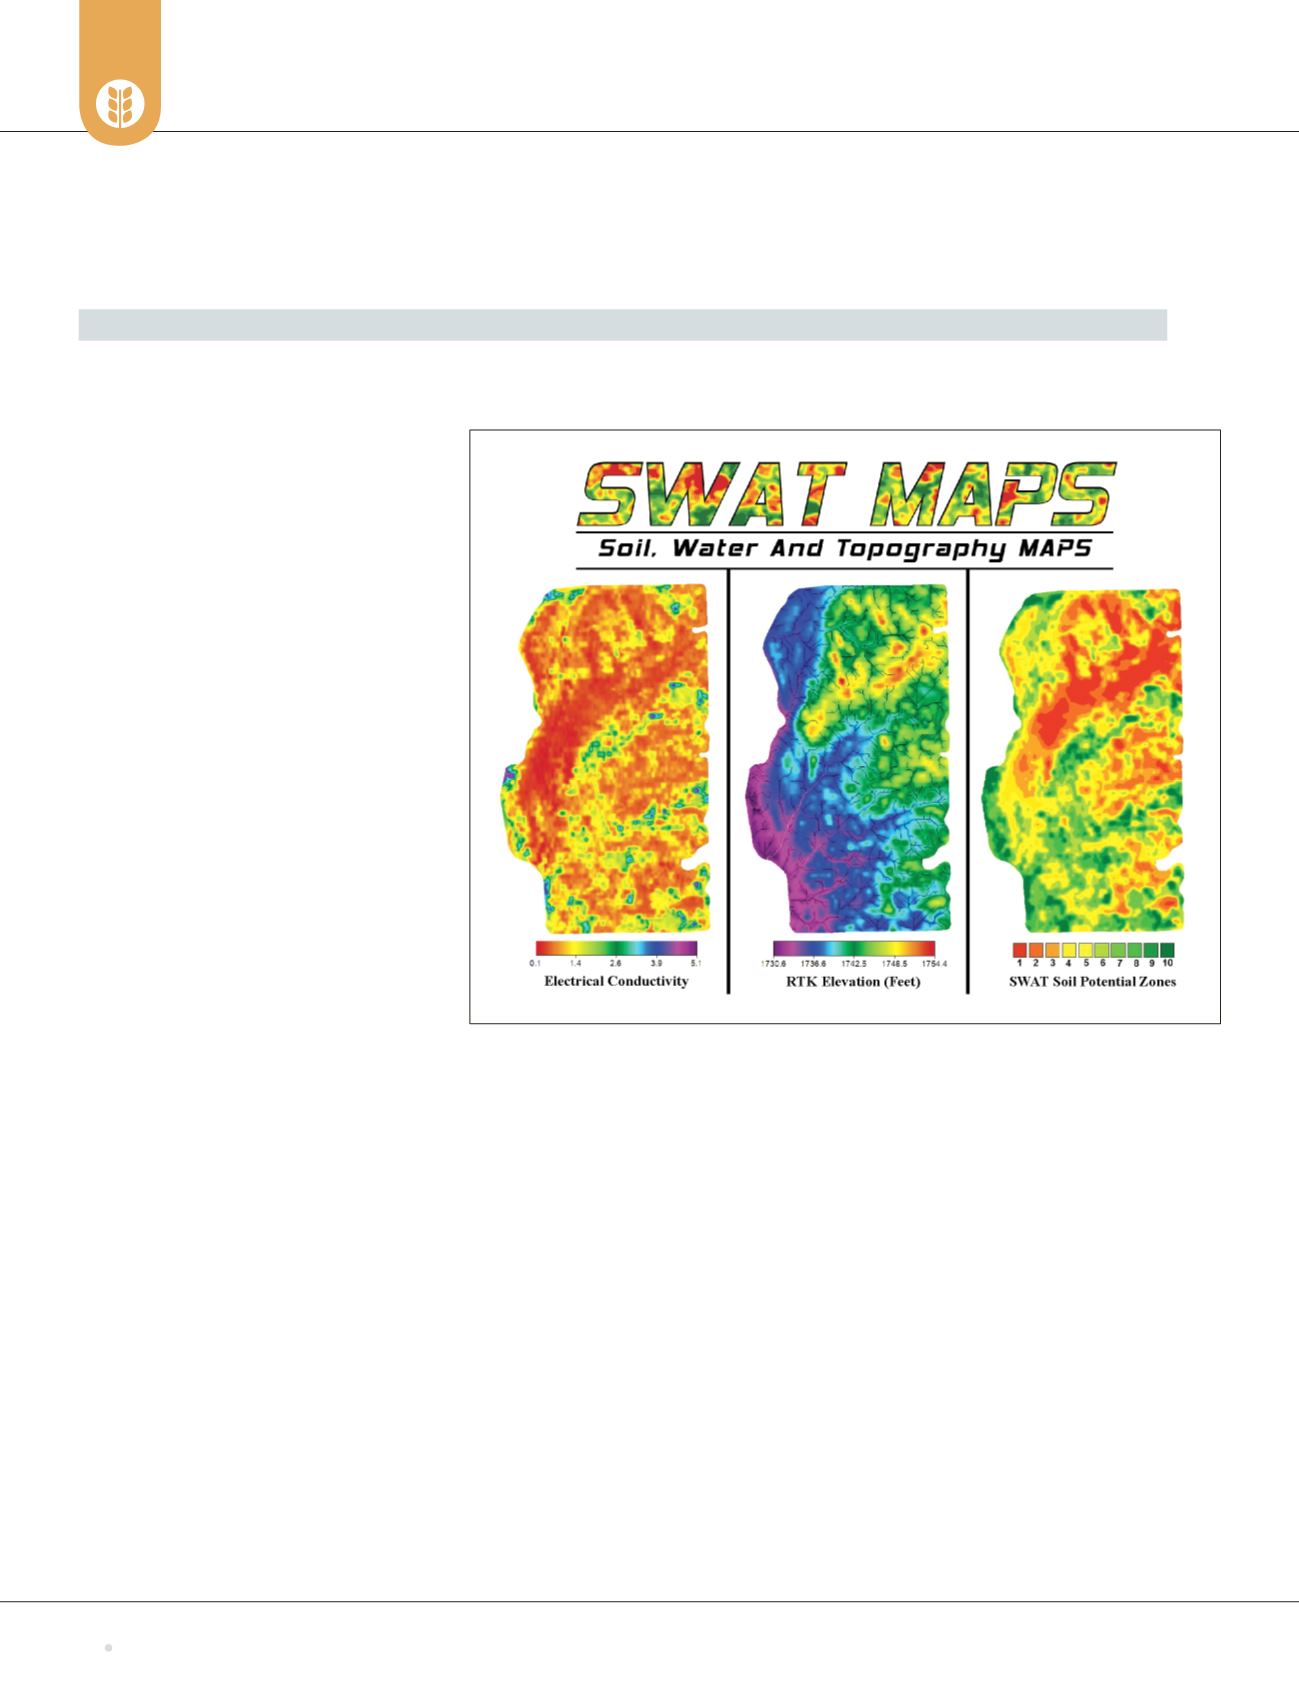
Soil electrical conductivity (EC) maps
are generated by towing a sled-mounted
sensor over the entire field and measuring
the conductivity of the soil to a depth of
1.2 metres. Sensor readings are affected
by moisture, texture and dissolved solutes.
The equipment also records elevation
changes across the field.
High EC ratings don’t necessarily cor-
respond with high soil potential; in fact,
Willness noted the highest yield potential
is in the middle ratings. Soils with high
moisture or clay content tend to conduct
In generating prescription fertilizer and seedmaps for its clients, CropPro Consulting utilizes multiple mapping
processes, but centres on soil, water and topography.
Images:CropProConsulting
Winter
2018
Grains
West
42