Winter
2018
grainswest.com13
BY TREVOR BACQUE
“The younger generation already has
had an impact on how companies are
marketing their products. That influences
the food space very deeply,” he said. “More
and more, consumers will not only buy
products based on specific needs, they’ll
actually buy products based on what the
product represents.”
The CCFI report also asked Canadians
where responsibility for transparency lies.
Food manufacturers were rated No. 1
in the categories of food safety, labour
and human rights in food production and
business ethics in food production. Farm-
ers were seen as those with the greatest
responsibility for impact of food produc-
tion on the environment and treatment of
animals raised for food. Government was
tied for first or finished second on four of
the five topics.
Two issues that come to mind for
Charlebois are that policy can only react
and governments are ignorant. “Policy
is always trying to adapt and catch up
to industry,” he said, adding that with
governments, “they do not tend to learn
from other governments.” He cited the
mad cow disease crisis of 2003 and the
Listeria outbreak in 2008 as two prevent-
able examples had the Canadian govern-
ment learned from other countries as they
suffered through similar crises.
Closer to home, Mackay encourages
farmers and others in the food system to
continue to advocate and tap into estab-
lished channels instead of reinventing the
wheel regarding food. “We haven’t stepped
up to give the good news,” said Mackay of
farmers and their sustainable practices.
“We’re too busy farming to talk about it.”
Add your voice to local Rotary club and
Facebook group discussions, she advised.
“It’s time to come together, look at all
tactics, look at it through a public trust
lens and how can you best amplify it if you
put it together with something else,” she
said. “People are saying it’s a priority. Now
we need to position it correctly.”
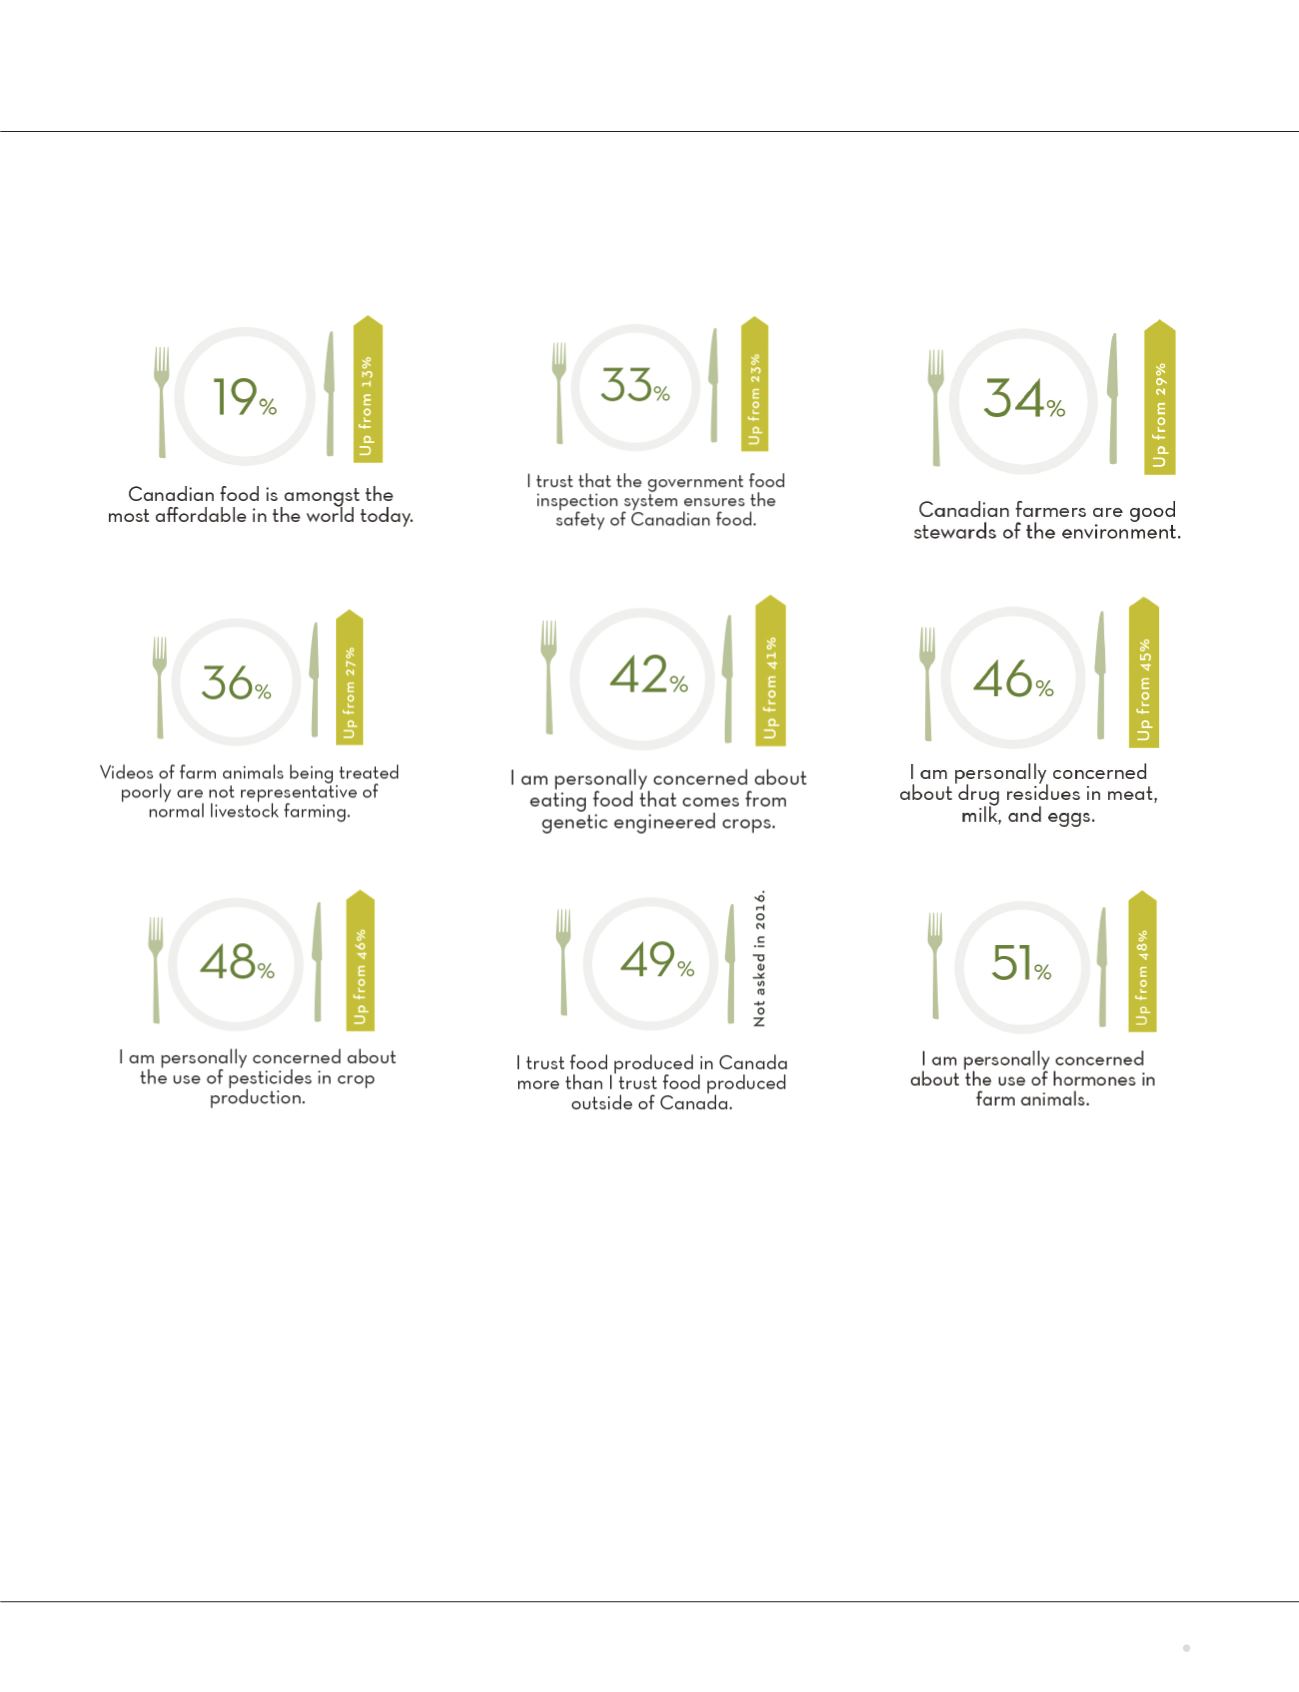
Illustrating the evolution of public opinion on food-system issues over time, the CCFI tracks trends in consumer attitude. The chart below notes the results of
several 2017 survey responses, with the percentage change over 2016 indicated within the green arrows.


